Excel LINEST Function
When you have data points given and you like to get the trend of these points, it is necessary to learn Excel LINEST function. It returns statistics that describe a linear trend matching known data points, by fitting a straight line using the least squares method.
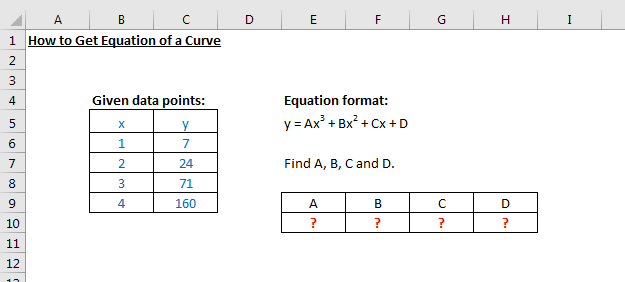
Description of Example
The example shows how to get coefficients of a polynomial given 4 data points. We will use LINEST function to fit the points in a curve with a single equation.
Description of Example
The example shows how to get coefficients of a polynomial given 4 data points. We will use LINEST function to fit the points in a curve with a single equation.
Evaluation of Formula
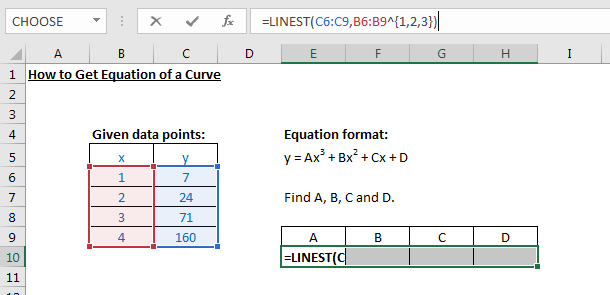
LINEST function works when there are known x values and y values. In this example, our known y values are given in ranges C6 to C9, while x values are in ranges B6 o B9. But because we are trying to get the coefficients of cubic polynomial, we need to enter the x values with superscript array from 1 to 3. Array can be distinguished by enclosed brackets '{ }'.
This formula will output 4 values, A, B, C and D, which is why we need to select 4 cells in a row (ranges E10 to H10 in below example) and then press Ctrl + Shift + Enter.
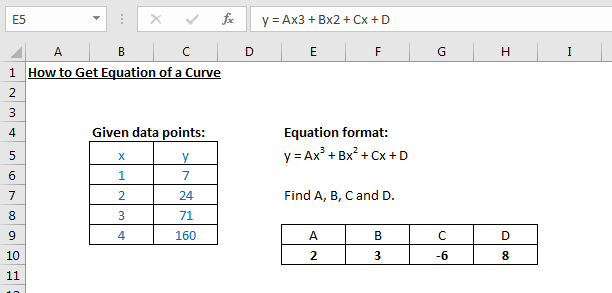
Output
The LINEST formula will return 4 values as expected and the unknown equation can be written as y = 2x3 + 3x2 - 6x + 8.
About Us
Excelcrib was founded in November 2017 by a Microsoft® Office Excel® (MS Excel) enthusiast with background in engineering. He's been using MS Excel for more than 15 years in practice with specialty in VBA.
Contact Us
Follow Us
© Copyright 2025 Excelcrib | Privacy Policy